When everything looks like a bank
Using banking frameworks to uncover opportunities in unexpected places


As I mentioned in a previous post, I spend a lot of time looking at banks in Eastern Europe.
The main reason is that when a bank runs well, it’s a great business to be involved with. Customers deposit their spare cash in exchange for a certain interest rate. The bank then uses the same cash to lend to other customers at a higher interest rate. The difference between the deposit rate and the lending rate covers the cost of the beautiful branches, the technology infrastructure, and the risk that some customers will not repay the borrowed funds. If the bank is well-run, the difference between the interest rates is more than sufficient to cover all expenses and generate significant profits for the bank’s owners. It should be that simple…
Somehow, it’s not. Over the years, banks have become involved in all kinds of financial investments, such as trading and the creation of synthetic securities, which makes it very hard to understand what they own, who they lend to, and how much money they can make. This leads to situations like in 2008, when 100+ year-old institutions disappeared practically overnight. This is why most investors stay away from banks, which is the second reason why I like analyzing them. It’s much easier to find opportunities in areas that other smart people avoid for non-fundamental reasons.
One side effect of analyzing banks for twenty years is that sooner or later, you start seeing bank-like features in other businesses. When used appropriately, this is a good tool for identifying (or rejecting) investment opportunities. For example…
Sunrun (RUN) is a solar systems rental company. It offers homeowners interested in solar power a way to get the benefits of renewable energy without the upfront costs. Sunrun installs the panels and batteries and signs 20-to-25-year contracts with credit-worthy customers that guarantee the company a stream of income. The hardware is mostly financed through debt secured by the hardware and by special investment vehicles that the company sells to investors.
Sunrun is clearly successful in getting consumers to subscribe, with the number of customers and total installed energy capacity growing more than 4x since 2019. That, however, is not an indication of whether it is a good business.
Looking at it as a bank, we can consider the installed panels as a loan for which it earns a rental yield. In 2025, this rental yield was 11.4%, which, on the surface, is pretty good. The problem is that it pays for the panels by borrowing at about 7.7%. The spread, or Net Interest Margin (NIM), is only 3.7%, which Sunrun must finance to cover marketing, installation, maintenance, and other administrative costs. Most years, these costs are well above NIM, and the company reports negative operating income. While there may be other reasons to invest in Sunrun, viewed through a bank’s prism, it is not a good one.
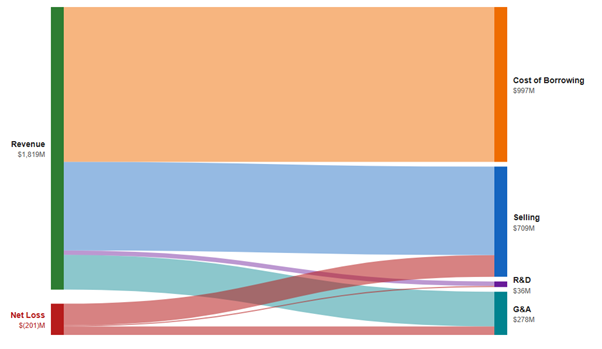
Sunrun 2025 Revenues and Expenses:
Contrast it with AerCap (AER), one of the largest aircraft lessors. AerCap buys planes from Boeing and Airbus and rents them out to airlines (large and small) worldwide. As one of the largest buyers of airplanes in the world, it can secure significant discounts from the listed prices. It rents the airplanes to airlines that are unwilling or unable to make the same commitments to the manufacturers, which requires multi-year planning. As a result of acquiring assets at a low price, AerCap usually secures a hefty rental rate relative to the purchase price.
In 2025, this rental yield was 13.2%. Just like in Sunrun’s case, the assets are financed via asset-backed debt. However, unlike with solar panels, debt markets are willing to lend against airplanes at low rates. In 2025, AerCap paid only 4.4% interest on its outstanding debt. The Net Interest Margin for AerCap is almost $4.7 billion or 8.8% of the balance sheet value of airplanes.
The costs, including depreciation, marketing, leasing, and administrative expenses, total roughly $3.9 billion. In banking terms, the cost-to-net interest margin ratio is the cost-to-income ratio. For AerCap, it is 67%. To put this number in perspective, a well-run bank, like JP Morgan, usually achieves a cost/income ratio of 50 to 55%. A good regional bank would be at 60-70%. By this measure AerCap looks like a good regional bank, though not a great one.
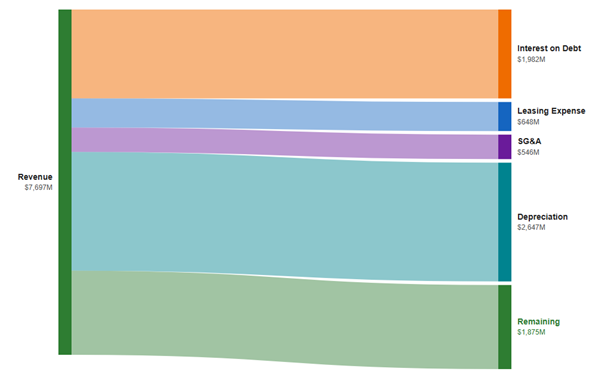
AerCap 2005 Revenues and Expenses:
Another measure of the bank’s quality is Return on Equity (ROE). It looks at a ratio of net income to the shareholder equity required to run the bank. Net Income is a catch-all measure that includes both real earnings, such as the net interest margin, and adjustments banks can make to estimate the value of their assets. These adjustments can sometimes be significant and are one reason most investors feel uncomfortable owning banks. There is way too much faith in management’s ability to estimate all the inputs correctly.
That said, ROE is universally accepted as a measure of bank quality. A good bank would usually generate an ROE of around 16 to 20%. A less good one would deliver 8-12%. For AerCap, I am estimating the “book value” as the difference between the value of the flight equipment and the associated debt. For 2025, this difference was $13 billion, on which the company earned over $1.8 billion in real operating income, equivalent to 7% ROE1. Once again, as a bank, it looks like an average one. This raises the question of why bother with what looks like a mediocre business.
The answer is in the last, but not least, check in my investment process - whether the company adds value through capital allocation. We already know that spending money on new planes is a good idea since they are earning good spreads on renting them out. In fact, spending on incremental airplanes historically, except for COVID, generated returns of 20-30%2.
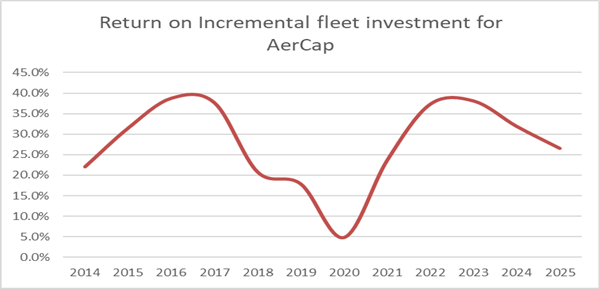
However, the need for airplanes is constrained by supply and demand. Boeing and Airbus together produce 1,500 to 1,700 airplanes per year, and this production is pre-sold for years in advance. Even if AerCap could add 1,000 planes in one year, it would not be easy to find customers willing to take them. Part of the reason AerCap is earning such good returns on incremental plane purchases is that it has a pretty good idea of what the market can handle.
This raises the question of what to do with the cash AerCap generates, which is not needed for fleet additions. One option is to pay down the debt secured by the aircraft, but the interest paid there is below 4.5%. The other option is to buy back shares. Most of the time, AerCap shares trade at a free cash flow yield3 of 10%+. The yield of 10% is much higher than the average for the S&P 500 and suggests that the market feels that AerCap earnings are not sustainable. Using the banking framework, we establish that AerCap business may not be fantastic but is not a bad one. By pricing company’s shares at high free cash flow yield, the market is giving the company an opportunity to create value through buybacks. Repurchasing shares that yield 10% is a better use of capital than paying down debt that yields 4.5%, and that’s exactly what AerCap does. Over the last three years, they bought back over 30% of the shares outstanding.
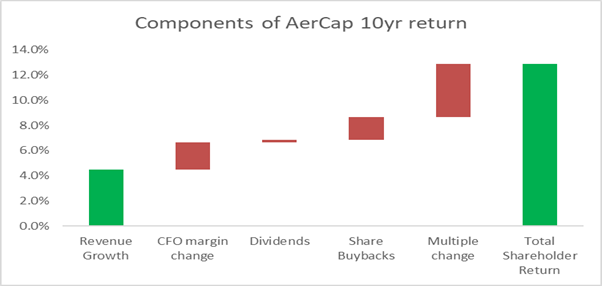
The returns to long-term shareholders at AerCap support the conclusion that AerCap, thanks to its capital allocation, is a good business to own. In the 10 years ending in December 2025, AerCap generated an IRR of almost 13%, delivering more than 3x return to the investors. Most of the return came from revenue growth, improved cash flow and profitability, and share buybacks.
An advantage of being a generalist (which I covered in detail in a previous post) is the ability to use frameworks from one industry to analyze businesses in another. Using frameworks from banking helped me identify and understand an investment opportunity that might otherwise have fallen into the “too difficult” pile.
Takeaways:
- Applying frameworks from one industry can help understand businesses in another one
- When market offers a chance to a decent business at a great price, buybacks can add value and enhance shareholder returns.
Disclaimer4
For this calculation I am ignoring one-off charges such as asset revaluations because they are volatile. I am also excluding taxes since they depend on the one-off charges. This is a back of the envelope calculation to see what kind of normalized returns the business earns.
The return is calculated based on change in free cash flow as defined in next footnote divided by Capital expenditures in excess of depreciation and net of the aircraft sales.
I calculate free cash flow yield as cash from operations minus depreciation that I use as a proxy for maintenance CapX for AerCap. Depreciation is an arbitrary number but given that most years AerCap sells aircrafts at a premium to book value it shows that the company is conservative in estimating the impact of wear and tear on its aircrafts.
The information contained in this post is provided solely for informational and educational purposes and should not be construed as investment advice, a recommendation, or an offer to buy or sell any security. Nothing herein should be interpreted as an offer to sell or a solicitation of an offer to purchase any interest in any fund, vehicle, or strategy. Any such offering may only be made pursuant to formal offering documents and only to persons who are “accredited investors” as defined under Regulation D, Rule 501 of the Securities Act of 1933, in connection with a private offering conducted under Rule 506(b), and who also meet the requirements of Section 3(c)(1) of the Investment Company Act of 1940 or any other applicable exemption.
The views expressed represent the author’s opinions as of the date of publication and are subject to change without notice. The author has no obligation to update, amend, or supplement the information contained herein. Certain statements may constitute forward‑looking statements, which are inherently uncertain and involve risks, assumptions, and factors that could cause actual outcomes to differ materially.
Any references to past performance, investment examples, or specific securities are for illustrative purposes only and do not indicate or guarantee future results. The discussion of any strategy, concept, or thesis is not a recommendation or endorsement and should not be relied upon when making investment decisions. I, Firebird, and accounts managed or advised by Firebird may hold positions in companies mentioned here. All investments involve risk, including the potential loss of principal.
Readers should conduct their own independent analysis and consult with their own financial, legal, tax, or other professional advisors before making any investment decision.